Introduction to Excel and Excel basics
Commitment: 6 weeks of study, 2-4 hours per week
About this model
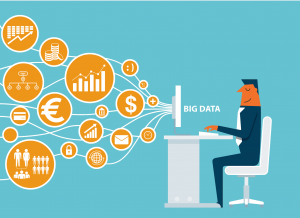
This will introduce executives to data-driven decision making in gaining competitive advantage and efficient performance in the organization. You will learn how to formulate business questions to be answered by data analytics. You will be empowered with the techniques to collect, clean and aggregate data from a multitude of sources across your business and/or externally. Executives will also be able to find out flaws in their datasets.
At the end of this module, professionals will learn how to plan and deploy analytics strategies for their business.
What to cover
- Essentials of data understanding
- Key elements in data analysis
- Requirements for a data analytics project
- Data sources
- Business rules in data analytics
- Data Visualization essentials
- Data Analytics tools

Introduction to Business Intelligence
Language: English
About this model
Business Intelligence provides key insights for your business leveraging the power of quantitative and qualitative data to enable you acquire actionable information to enhance both your business and clientele in making decisions. This module will introduce you to business intelligence, its importance and how businesses are tapping into business intelligence when delivering outcomes for their clients.
You will acquire practical knowledge on how to gather relevant data and present your insights and recommendations to your fellow executives, stakeholders and clients.
What to cover
- Fundamentals of Business Intelligence
- Understanding business data
- Business Intelligence Output
- Government and Public Policy Intelligence
- Economics and Finance Intelligence
- Educational Intelligence
- Non-Profit Intelligence

ETL and Spreadsheets
Language English
About this Model
This module empowers executives with the skills to collect and cleanse hundreds of millions of data from a number of sources using the most used spreadsheet software Ms Excel.. You will be introduced to the power excel workflow and when to use these tools to answer business questions of all types.
This module will enrich executives with skills to perform powerful ETL (Extract-Transform-Load) processes with Ms Excel. You will learn how to automate cleaning tasks in Ms Excel without employing code whatsoever. By the end of this module, executives will be able to connect to an immense pool of core systems I.e. databases, webpages, cloud technologies, CRMs, HRMs, ERPs, etc. and clean this data within a few seconds. You will also be able to load all kinds of big data (more than a million rows).
What to cover
- The Most used Business Intelligence Platforms
- Introduction to Power-Excel Workflow
- ETL I: Extract and Load
- ETL II: Transform

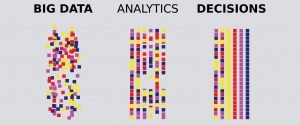
Business Intelligence and Data Analytics
Language English
About this level
This module will introduce and professionalize executives to techniques of database deign and normalization using advanced features of the world’s most used spreadsheet program Ms Excel. You will be able to connect various number of tables, sources and/or fields to each other to develop cross platform analytics without spending a lot of time.
Executives will be able to build robust business models in finance, sales, marketing, audit, manufacturing, to mention but a few. These will enhance analysis across platforms from different sources, systems, workbooks and/or external sources that have relationship and can be used to answer business questions if manipulated together.
Executives will also learn the powerful business intelligence language of Data Analysis Expressions (DAX) that will be used to answer all types of business questions from ratio analysis to time intelligence. This language will also allow users to analyze billions of data in Ms Excel in a matter of seconds. Executives will be able to generate insights in different dimensions and paradigms to answer even the most complex of questions within a matter of seconds.
At the end of this module, executives will be able to build self-sustaining business intelligence solutions in Ms Excel that will be both robust and recyclable for other end users to answer questions in different fields from accounting, audit, other departments in finance, HR, marketing, business development, research, risk, etc.
What to cover
- Introduction to Data Modeling with Spreadsheets
- Data structuring and Joins
- Introduction to Big Data manipulation in spreadsheets
- Big Data Operations to answer business questions
- Time Intelligence
Complex Structures and Data Models
Language English
About this model
Executives are introduced to more advanced methods of data analytics in spreadsheets with solutions built from more complex models that will further granularize the analysis of a given stream or streams of data.
You will be equipped with skills to highlight key performing areas, or red flags in your datasets. Also, more advanced techniques like Banding and Morphing Switches will enhance tasks in granular audits and accounting setups.
You will further be able to move your data models from the PivotTables to the worksheet to enhance dynamism in design and structuring to best suit your needs. This section is to free you from the constraints Pivots seem to have in giving you autonomy.
What to be covered
- Working with disconnections
- KPI
- Cube Formulas

Introduction to Data Visualization and Reporting
Language English
About this model
Data visualization enables Executives to make complex presentations simple, the abstract tangible and the invisible visible. Modern audiences lose interest in very complex visualizations thus you need to get a message across quickly and efficiently.
This module introduces you to the powerful impact of visualizations in presentations. Executives will learn how to interpret and properly visualize data. This section will ensure you know the best practices in data visualization so that you don’t mislead your audiences. Executives who complete this module will step out from the crowd with the most compelling visualizations.
What to be covered
- Introduction to Storytelling
- Best practices of data visualization in a BI project
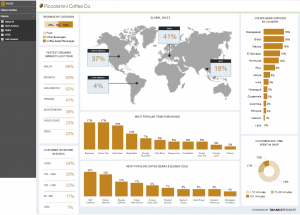
Visual Analytics and Business Dashboards
Language English
About this model
Explore the power of advanced visual analytics with one of the world’s most powerful data visualization tools Tableau. Executives will discover a multitude of stories in their business data with interactive dashboards.
You will acquire the skills to build dynamic reports that expose in-depth analytics to management, boards and other executives, and/or clients. We a taking a ground up approach with every tiny bit of knowledge covered in visual analytics with tableau.
Executives will build interactive dashboards with advanced presentation kits that will make the intangible tangible and the abstract simple. You will build robust financial dashboards, marketing scoreboards, business intelligence tools and corporate presentations that will put you up there with the big dogs.
What to be covered
- Introduction to Tableau for BI
- Visual Analytics and parameters
- Dashboard Enterprising
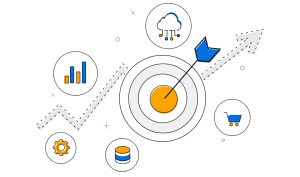
Tools for forecasting in BI
Language English
About this model
Executives will employ robust predictive analytics models to forecast key performance indicators in business from quarterly sales, pricing models to projected cashflow models. You will build powerful hedonic models that can be used to score key performers and detect fraudulent behavior.
This module will also empower professionals with techniques to manipulate information on the internet to forecast statistics from unemployment rates to projected lending rates. Also, industrial growth projection will be subject to many tools.
You will be able to use data to tell your customer’s story and improve your approach to a customer’s journey. Use cases and applications from acquisition to customer retention will be of keen subject.
A number of powerful predictive modeling tools will be employed from Moving Averages to Regression analytics. Stay ahead of your competition.
What to be covered
Visual Forecasting
Errors, Bias and Accuracy tests
Trendlines
Exponential and CAGR
Seasonality
Econometric Modeling and Regressions
Applications in BI Forecasting